
 RSS Feed

|
OUR OFFICE
|
SAY HELLO
If you are interested in working with us or just want to say hello simply drop us a line!
Email: info@investmentscy.com Phone: +1 (917) 512-9523 |
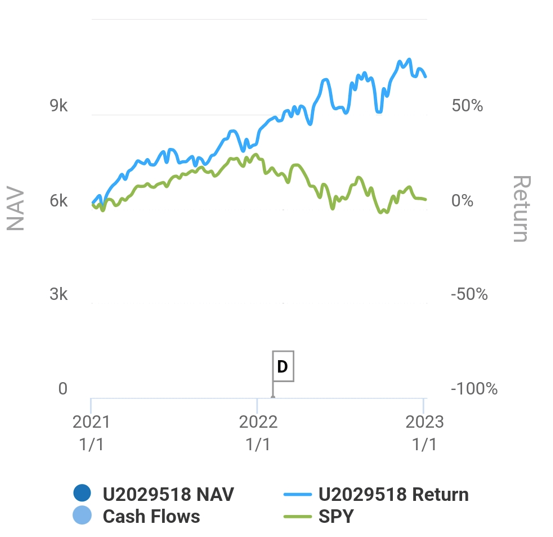
Our Returns As Of 2023
|